Statistics in QR Guide
Short summary
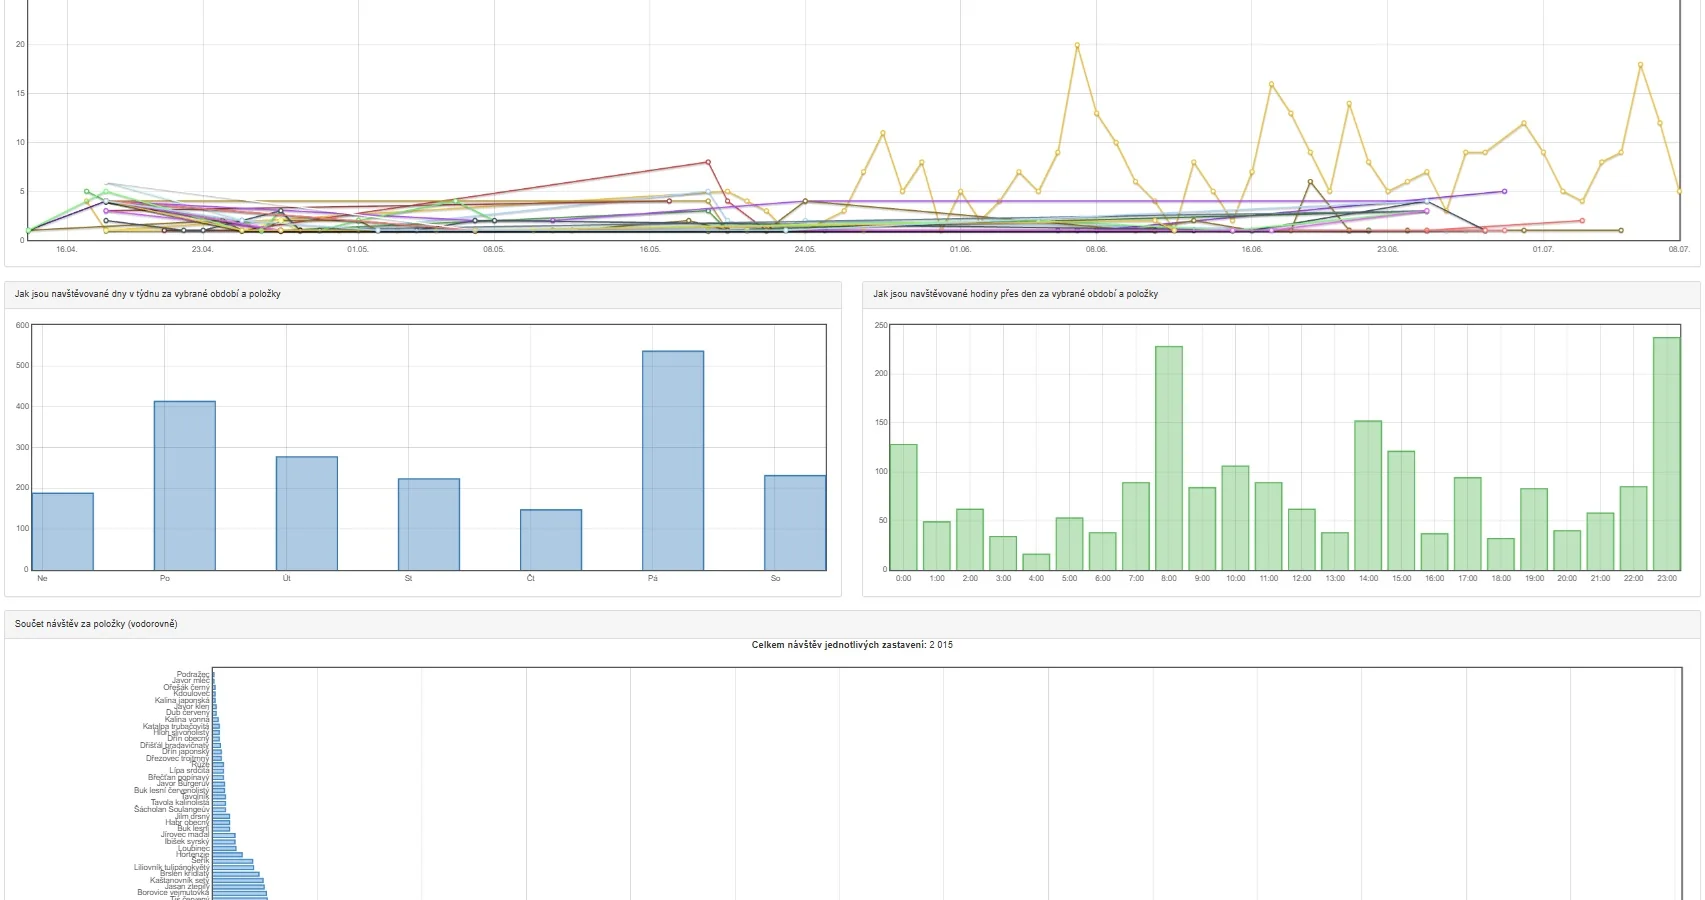
Visitor statistics show how often each stop is viewed, which languages are used and which days or hours bring the most traffic.
- views by stop
- visitor language
- time and day of use
What statistics say about real interest
For an interactive guide, it is not enough to know that the site exists. You need to see which stops people open, when they return and whether they use text, audio, video or galleries.
- views by stop
- visitor language
- time and day of use
How data helps museums and towns
Statistics turn route improvements into decisions. A rarely opened QR code may be poorly placed. A popular stop may deserve audio, video or better photos.
- move a sign
- shorten or expand text
- add a language version
What to check after the first month
The first month usually reveals technical and navigation issues. Review the least used stops, check their physical placement and compare usage by language.
- least opened QR codes
- most read stops
- share of local and foreign visitors
Avoiding false conclusions
Low numbers do not automatically mean bad content. The problem can be glare, a small sign, weak signal or unclear instruction. Combine statistics with a short on-site test.
- check QR readability
- test loading speed
- walk the route as a visitor
Where to continue
Explore related solutions or view pricing:
Want a similar guide?
Send us a short description of your exhibition or route. We will recommend the plan and content preparation process.
Request a QR Guide quote